CBB752 Spring 2017 Final Project
Project Title
Compare the variants in Carl’s genome with those found in the GTEx database. Use the results to predict gene expression in various tissues and better estimate the impact of noncoding variants in Carl’s genome.
Table of Contents
Introduction:
In this project we discuss the effect of genetic variation on tissue-specific gene expression. We first describe eQTLs, which affect the tissue-specific expression of genes and may play a role in causing phenotypes, including disease. We also address GTEx, the extensive database of genetic and expression information that is used to predict causal variation. We next propose a computational tool that can be used to identify eQTLs in the genome of Carl Zimmer and predict changes of gene expression in specific tissues. Finally, we identify eQTLs in the Zimmerome in multiple tissues.
Writing:
Describe eQTLs and the GTEx database. How were the data present in GTEx generated and what scientific questions does it help answer?
An individual’s genome is effectively identical in every cell of their body. Clearly, however, the cells of the body are not all identical in form and function. They perform many different roles and take many shapes in order to do so. To allow this, gene and protein expression vary between organs, tissues, and cell types. That is, while a gene may be identical in two cells, the amount of mRNA transcribed from that gene may differ, or even be completely absent in one cell; this is a change in gene expression. Similarly, the amount of protein translated from the mRNA of that gene may be greater in one cell than another; this is a change in protein expression.
Quantitative trait loci (QTLs) are regions of the genome that influence a measurable phenotype in an organism. Two specific types of QTLs are protein QTLs (pQTLs) and expression QTLs (eQTLs). pQTLs influence the amount of protein that is translated from a gene, while eQTLs influence gene expression, or the amount of mRNA that is transcribed from a gene. These two measurements may or may not correspond with one another, so while some sites in the genome may be both eQTLs and pQTLs, many sites are considered one type of QTL and not the other.
There are two main ways to categorize eQTLs. First, eQTLs may be local or distant, referring to the distance between the eQTL and the gene whose expression it affects. Intuitively, local eQTLs influence the expression of nearby genes, which are generally defined as genes that reside on the same chromosome, while distant eQTLs influence the expression of genes that reside on different chromosomes.
Second, eQTLs may be cis or trans. Trans eQTLs affect genes via dispersed signals, so they may affect genes on distant chromosomes. Cis eQTLs, however, directly affect genes that reside on the same chromosome as the eQTL, often by influencing transcription factor (TF) binding, which may be involved in epigenetic or transcriptional regulation. Cis and trans eQTLs can be identified by comparing the expression levels of the affected gene in individuals that are heterozygous.
For example, consider an eQTL variant at site A that increases the expression of nearby gene B, and an individual who is heterozygous at both sites, so that they have the genotype AaBb. Suppose that the alleles A and B reside on the same chromosome, while a and b reside on the homologous chromosome. In this case, if the eQTL A is cis-acting, only the expression of allele B will be increased. However, if the eQTL is trans-acting, the diffusible factor will affect the expression of both alleles similarly, so the expression of both B and b will increase. This is known as an allelic effect.
It is important to note that while trans eQTLs may be local or distant, all cis eQTLs are local by definition. Trans eQTLs often occur in regulatory genes, but they are often less well-characterized than cis eQTLs. Similarly, while many local eQTLs are known in humans, it is difficult to collect enough data to prove the existence of distant eQTLs. Generally, local eQTLs are more impactful and less likely to be limited to specific tissues, and are therefore easier to study.
In humans and other organisms, eQTLs may be classified into “hotspots,” meaning that the eQTL site affects the transcription of many other genes. These sites are of great interest and potential clinical relevance.
eQTLs are discovered in large correlation studies, which are difficult because vast amounts of data are needed in order to achieve statistical significance. In such studies, the genome (complete genetic sequence) and transcriptome (complete mRNA sequence) of each individual is obtained. While the genome is common among all of an individual’s cells, the transcriptome will vary from cell to cell, so it may be sequenced from multiple sources for each individual. Once these data are obtained, each possible pair of genes (for example, gene A and gene B) is analyzed to see whether variants in the genetic sequence of gene A correspond with changes in the expression of gene B across all of the experimental samples. This is very computationally expensive, but technology is improving to allow this process to increase in speed and precision.
eQTL maps are assembled for many tissues, cell types, and conditions with the goal of finding variants, including single nucleotide polymorphisms (SNPs), that correlate with differential expression of a gene. Once eQTL maps are assembled, they are extremely useful, particularly to quantify disease risk. Once identified, the mechanism of an eQTL’s effect on gene expression can be investigated. Additionally, the effect of gene expression levels on higher phenotypes is an important consideration, since variable expression could contribute to disease.
To this end, eQTLs can be used in combination with results from genome-wide association studies (GWAS). These studies are performed in large groups to determine whether particular genetic variants are correlated with disease. eQTLs can then be used to bridge the gap in GWAS studies, by connecting a genetic variant to a change in gene expression, which may be causative of the disease phenotype.
In 2010, the National Institutes of Health (NIH) began the Genotype-Tissue Expression (GTEx) Project. The overall goal of this project is to study how genetic changes affect disease via gene expression variation, with the eventual hope of developing preventions or treatments for diseases. To this end, the GTEx Project collects genome and expression data from many individuals and tissues for eQTL identification.
The GTEx Project consists of an online database, which was developed by the National Center for Biotechnology Information (NCBI), and a physical tissue bank, which is run through the National Cancer Institute’s cancer Human Biobank (caHUB). The information and tissues collected by the Project are then available for research use.
To populate the physical tissue bank, the GTEx Project recruits two donor types: surgical donors and organ and tissue donors. Surgical donors are living patients who are scheduled to undergo surgery. Before the surgery takes place, the patient may volunteer to have some of their removed tissue donated to the GTEx Project. This may only be tissue that was already intended to be removed in the surgery; no additional tissue is removed from the patient for use by the GTEx Project. Tissues obtained from surgical donors include blood, muscle, skin, and fat.
Organ and tissue donors are deceased individuals who consented (or whose families consented) to donate their organs and tissues after their death. Importantly, these tissues will only be donated to the GTEx Project if they are ineligible for transplant, which takes priority. Tissues obtained form organ and tissue donors include fat, skin, blood, and whole organs.
In addition to their tissue, donors also contribute their health information, including their history of disease and medications and cause of death (if applicable). However, no personal or identifying information is included. Donors do not receive any payment or other benefits from their involvement in the GTEx Project. They can choose to withdraw their tissue from caHUB, but cannot withdraw tissue that has already been distributed to researchers. Otherwise, once donated, the tissues are stored in caHUB indefinitely.
Once the tissue is obtained, each donor is genotyped and the mRNA from their donated tissue is sequenced to measure gene expression. This information is then added to the GTEx Database. As of December 2015, the GTEx Project had recruited 961 donors and obtained more than 30,000 samples. The GTEx Database is a resource for researchers, where they can view or download information gained from these donors, such as de-identified genotypes, expression data, and other clinical information.
The GTEx Project has already enabled research breakthroughs. For example, the GTEx database has been used in the study of schizophrenia. While over 100 genetic loci are known to be associated with the disease, their function is unknown. Using the GTEx database, it was discovered that many of these loci contain eQTLs that alter brain-specific gene expression, some of which are probable to be involved in neurodevelopment. These are therefore good candidates for disease-causing variants.
Another interesting result is in the field of evolution, specifically focusing on gene duplication. New genes are added to the genome when existing genes are duplicated. However, this should double the amount of that gene product that is present in the cell; such dosage effects are expected to be detrimental. In most instances, a duplicated gene acquires a mutation that renders it nonfunctional, eliminating the excess dosage. However, in rare cases, the newly duplicated gene gains a new function by mutation and is slowly adopted by the population. In these situations, researchers investigated how new genes were able to persist long enough to gain a functional mutation without causing deleterious dosage effects. Data from the GTEx Project has been used to reveal that when genes are duplicated, expression from both genes is reduced to decrease the overall dosage. This allows both genes to evolve separately over time, increasing the possibility of the evolution of novel functions.
Coding:
Propose a tool to identify eQTLs in a subset of Carl’s variants using the GTEx database. What expression changes would you predict in Carl? Make sure to cover tissues that can be easily assayed.
Basically the scripts want to find the Zimmerome SNPs that are biologically significant according to GTEx eQTL database.
Documentation:
final1-2.2.py
Version 2. This is a tissue-specific version of last code. Added a -t tissue specifier to achieve that. Also, a time indicator (by the lines read) is added to estimate required time.
final1-2.3.py
Version 3. Here version 3 is literally the same with version 1 (because during polishing up version 1 becomes the same with 3). Integral code to run through all tissues. But not actually so much used in consideration of time.
final1-2.x.py
This code is not the code for generation of consistent records, but to analyze the generated records for general overview. It includes three parts:
- cut the variant_id into more informative pieces;
- get the intersect snp-gene_pairs of the tissues and print them out;
- get the statistics of the ZSNPs: tissues, numbers and percentages.
Since the files are large, they run not so fast. Maybe it would be faster to read in GTEx SNP records as dictionary and compare the two dictionaries, but hard to include the rest information (e.g. effect size).
Usage
The most useful version is version 2: tissue specific comparison between Zimmerome and GTEx eQTL record.
Command line example of final1-2.2.py:
python final1-2.2.py -i -m
-t ###USAGE
python final1-2.2.py -i GTEx_Analysis_v6p_eQTL -m Z.variantCall.SNPs_filt.vcf -t ‘Whole_Blood’ ###EXAMPLE
###eQTL analysis of Zimmerome
Requirement
Here I use Python 2.7. Files needed include Zimmerome SNP file (Z.variantCall.SNPs.vcf, from https://zimmerome.gersteinlab.org/2016/05/06/part01_gerstein/, but its comment was removed to generate a readable table), GTEx eQTL of different tissues (V6P, downloaded from GTEx portal, https://www.gtexportal.org/home/).
Results:
Results divide into three parts:
- I ran the code on five tissues of GTEx database: Adipose Subcutaneous, Brain Cortex, Live, Pancreas and Whole Blood. In this way, I filtered out those Zimmerome SNPs that are recorded in GTEx eQTL database: ZSNPs_*_sep.txt
- I then generate the intersect of SNPs across the five tissues (existing in all the five tissues): ZSNPs_intersect.txt
- After that, I generate a statistical report to summarize the SNP information of these five tissues: ZSNPs_statistics_more.txt
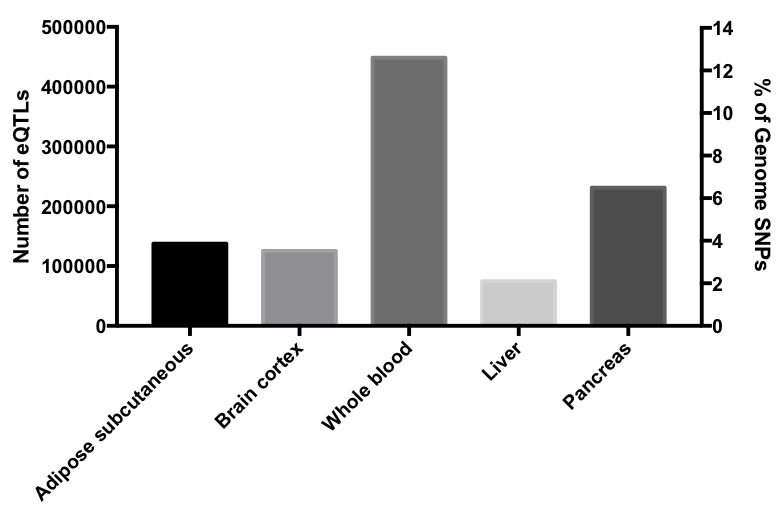
First, from the number of SNPs in different tissues, it shows that more important tissues have a higher rate of SNPs to be recorded in GTEx eQTL database, which means to some extent they are more common. There are more than 5 thousand SNP sites that are common across the 5 tissues and resulting in more than 70 thousand SNP-gene pairs. This ranges from about 6% to less than 1% in each tissue. Among these, adipose cutaneous has the lowest percentage of SNP-gene pairs to be common, while brain cortex has the highest, which is consistent with the last conclusion. These data show that different tissues have different SNP sensitivity and tolerence, but most of the SNPs are tissue-specific.
Here below is the table that contains the numbers of SNPs and SNP-gene pairs of Zimmerome, coverage of Zimmerome SNPs, and the comprising proportion compared to GTEx database (same as ZSNPs_statistics_more.txt):
| tissue | #zsnps | #snp-gene_paris | coverage | percentage |
|---|---|---|---|---|
| Adipose Subcutaneous | 137526 | 1311216 | 3.93 | 10.5 |
| Brain Cortex | 125373 | 154580 | 3.59 | 81.1 |
| Liver | 74823 | 189024 | 2.14 | 39.6 |
| Pancreas | 231229 | 526676 | 6.61 | 43.9 |
| Whole Blood | 448413 | 1060536 | 12.8 | 42.2 |
Pipeline:
Documentation:
Part A. Test runs of the codes developed in the coding part
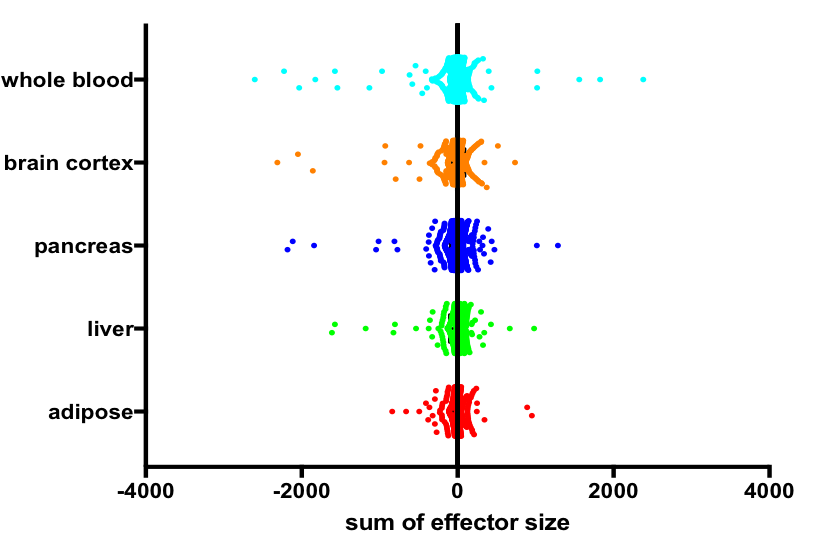
The germline SNP call set was compared with single-tissue eQTL dataset from GTEx portal using the codes developed in the previous part, with subcutaneous adipose tissue, liver, pancreas, brain cortex and whole blood chosen as reference tissues. Lists of identified eQTLs in subject Z’s genome as well as corresponding genes are attached to this summary. Data were further processed to estimate the cumulative effect of multiple SNPs on a single gene by calculating the sum of their effector size (normalized to standard deviation of gene expression in GTEx database). The subset of genes with cumulative effect of larger than 10 fold increase or decrease, as well as the top 10 genes with highest magnitude in increased/decreased expression was also attached to this file.
Part B. Analysis with external software
SNP dataset of subject Z was annotated with dbSNP ID using the dbSNP VCF file containing all common SNPs, defined as SNPs whose minor allel has a frequency higher than 0.01 in at least one population tested. Due to limitations in data processing capacity of online platforms, a subset of SNPs located on the first 3,000,000 base pairs on chromosome 1 was extracted as input dataset, representing approximately 0.1% of human genome length. Annotation and extraction was carried out using the SnpEff platform.
Results:
Part A
The numbers of identified eQTLs range from ~75,000 to ~450,000 according to different tissues examined and accounts for up to 13% of SNPs in subject Z’s genome. The subset of genes expected to have elevated or decreased expression was processed with GO enrichment analysis for biological processes. No significant enrichment in any biological process was observed, consistent with the notion that the overall effect of SNPs in subject Z’s genome should be neutral and dispersed throughout different biological functions. However the total eQTL dataset was enriched in certain biological processes that are not immediately pertaining to the physiological function of the tissues examined; generally, immune-related genes are shown to have higher representation among eQTL-affected genes. The analysis reports were attached below. In addition, 5365 SNPs were found to be eQTLs in all tissues tested. GO enrichment analysis didn’t show any highlighted biological processes.
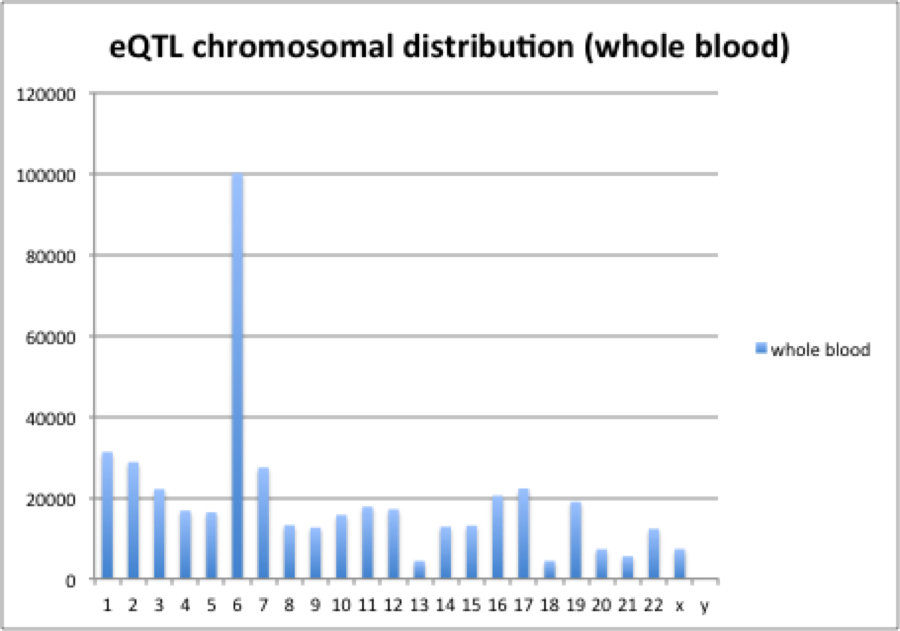
Distribution of eQTLs showed substantial chromosomal bias. Across different tissues tested, chromosome 6 was shown to be enriched in eQTLs even after normalization to total SNPs. Mapping of eQTLs from whole blood along Chromosome 6 identified that a relatively short genome region significantly enriched in eQTLs. Histogram of eQTL distribution is show in the following graph.

The distribution of cumulative effect was observed to be normal, with mean value around 0. However, genes significantly enriched in eQTLs that are predicted to have positive/negative effect on expression were also seen in the analysis. Scatter plot of genes and estimated sum of eQTL effector size is shown below.
Part B
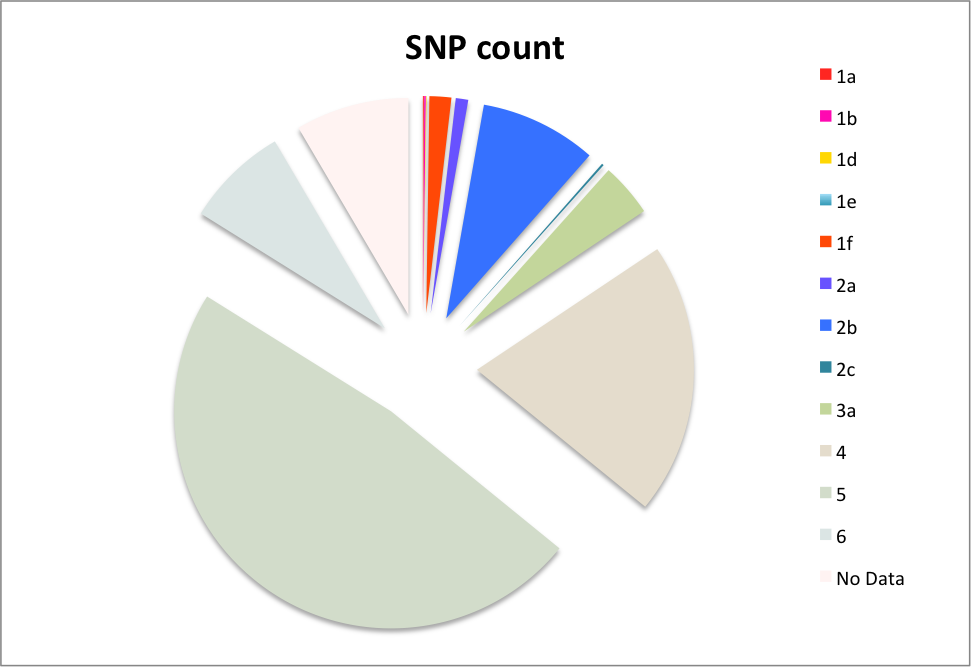
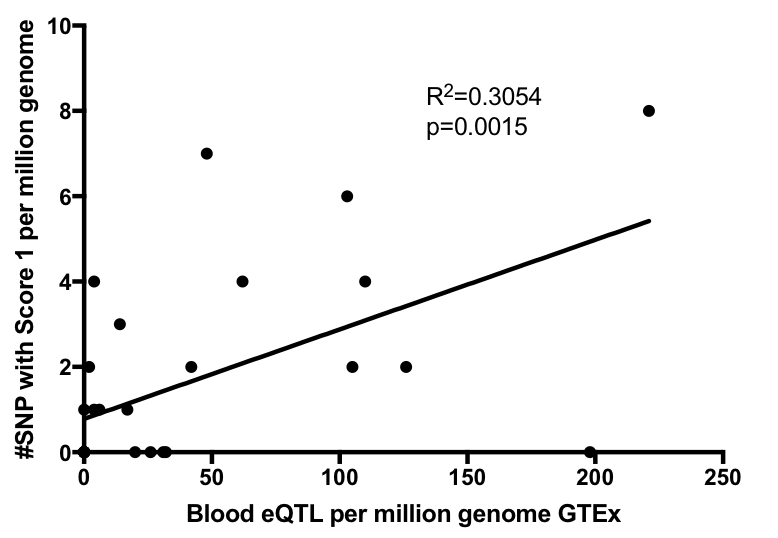
The input VCF files were analyzed using regulomedb.org online platform, which helped to identify 2587 SNPs from 3121 input lines. 48 SNPs (1.9% of total 2587 counts) scored 1f or above were predicted to affect protein binding and expression level. Additionally 253 SNPs (9.78% of input) scored 2c or higher are predicted “likely to affect binding”. Majority of eQTLs identified through this platform affecte gene expression in blood cells (monocytes and lymphoblastoid). Statistics of regulome scores of all SNPs tested is presented in the following chart.
One example of eQTL identified in subject Z’s genome is rs1886730, located on chromosome 1: 2488607, predicted to affect gene expression of TNFRSF14. The protein product is functionally related to immune and inflammatory responses and has been shown to mediate the entry of herpes simplex virus into the cytoplasm. Footprinting experiment showed that rs1886730 lies in the binding motif of the transcription factor FOXO6; ChIP-Seq experiment also indicates that the DNA sequence harboring the SNP binds with numerous transcription factors. In smooth muscle, lung and lymphoblastoid cells this genome region was found to be flanking actively transcribing TSS. It is likely that polymorphism at this nucleotide directly affects TNFRSF14 expression via modulating binding affinity of transcription factor to DNA.
Conclusions:
The overall frequency of eQTLs identified through RegulomeDB is much smaller than that observed through direct comparison with GTEx database. The possible explanation for such discrepancy lies in 1. Only the common SNPs (with frequency larger than 0.01 among at least one population) were used for annotating Carl’s genome, which potentially leads to the underestimation of eQTLs by ignoring rare SNPs; 2. Chromosomal bias in SNP and eQTL numbers. The input sample represent only 0.1% of total genome at one terminus of chromosome 1, and may thus biasedly represent the distribution of eQTLs in different genomic regions. Majority of eQTLs identified through RegulomeDB comes from blood cells, which is consistent with our result from direct comparison with GTEx database. This tissue bias is possibly a result of larger sample size due to easy accessibility of blood; however, immune-related genes actively transcribed in leukocytes might be more prone to regulation by eQTLs, as our GO enrichment analysis showed specific enrichment in immune-related genes in other peripheral tissues.
Source code
References:
Albert FW, Kruglyak AM. 2015. The role of regulatory variation in complex traits and disease. Nature Reviews: Genetics 16:197-209.
Genotype-Tissue Expression (GTEx). 2017. NIH; [March 31, 2017]. https://commonfund.nih.gov/GTEx/index
Genotype-Tissue Expression Project (GTEx). 2016. NIH; [January 7, 2016]. https://www.genome.gov/27543767/genotypetissue-expression-project-gtex/
NIH launches Genotype-Tissue Expression project. 2010. NIH; [July 17, 2012]. https://www.genome.gov/27541670/2010-release-nih-launches-genotypetissue-expression-project/
Shabalin AA. 2012. Matrix eQTL: ultra fast eQTL analysis via large matrix operations. Bioinformatics 20:1353-1358.